Step 2 - Observability (Tracing & MLflow)
Goal
In this step you will enable two complementary observability backends for the same Typer CLI:
| Backend | Use case | Toggle |
|---|---|---|
| Azure Monitor / Foundry | Portal-based tracing of LangChain calls in Foundry | --tracing |
| MLflow (local) | Local trace inspection for LangChain / LangGraph, Microsoft Agent Framework, and GitHub Copilot SDK | --mlflow |
Both toggles are mutually independent and can be combined.
Observing VS Code GitHub Copilot itself
This step targets observability of the concierge application (LangChain / LangGraph / MAF / Copilot SDK code paths). To monitor the VS Code Copilot Chat extension in the editor (Copilot operations, tokens, tool calls, per-model TTFT) via an OTel collector and Azure Application Insights, see Monitor VS Code Copilot via App Insights. The two pipelines are independent and can run in parallel.
Microsoft Agent Framework support
MLflow does not provide a dedicated mlflow.<flavour>.autolog() for
Microsoft Agent Framework. Instead, MAF spans are forwarded to the
tracking server's /v1/traces endpoint via the OpenTelemetry HTTP
exporter (upstream docs).
enable_mlflow() wires this exporter automatically when the
tracking URI is an http(s):// MLflow tracking server, so a single
--mlflow flag (or CONCIERGE_MLFLOW_ENABLED=true) covers every
supported agent backend.
GitHub Copilot SDK support
GitHub Copilot SDK sessions emit their OpenTelemetry spans from the
Copilot CLI subprocess, so mlflow.<flavour>.autolog() cannot pick
them up. Instead, concierge.observability.build_copilot_sdk_telemetry_config()
constructs a copilot.client.TelemetryConfig whose otlp_endpoint
is the configured MLFLOW_TRACKING_URI and passes it through
CopilotClient(config=SubprocessConfig(telemetry=...)). The Copilot
CLI then pushes spans directly to the MLflow tracking server's OTLP
ingestion endpoint, so github-copilot-sdk traces show up in the
MLflow UI alongside the other agent backends. When the tracking URI
is not HTTP(S) (e.g. file: or sqlite:),
build_copilot_sdk_telemetry_config() returns None and the
Copilot SDK runs without telemetry as a graceful fallback.
Why this step exists
LLM applications are hard to debug because the interesting state lives between the prompt, the model, and the tools. Capturing that state in traces lets you answer questions like:
- which prompt produced the bad answer?
- how long did each step take?
- how many tokens did each call consume?
This step wires LangChain to Azure Monitor through the
AzureAIOpenTelemetryTracer,
and adds MLflow autologging so you can iterate offline without leaving the
laptop.
flowchart LR
    subgraph Sources["Sources (CLI / Web / Worker)"]
        CLI_CHAT["chat-cli"]
        WEB_CHAT["chat-web (FastAPI)"]
        CLI_CA["cloud-agent-cli"]
        WEB_CA["cloud-agent-web"]
        WORKER_CA["cloud-agent worker"]
        CLI_TODO["todo-cli"]
        WEB_TODO["todo-web"]
        VANILLA["scripts/*/vanilla.py"]
    end

    subgraph Shared["concierge/observability.py"]
        ENABLE["enable_tracing() / enable_mlflow()"]
        BOOT["bootstrap_from_env()"]
        TCONF["trace_config(service_name)"]
        TRACER["get_tracer(service_name)"]
    end

    Sources -->|"--tracing / --mlflow"| ENABLE
    Sources -->|"CONCIERGE_*_ENABLED=true"| BOOT
    ENABLE --> TCONF
    TCONF --> TRACER

    subgraph Runtime["Runtime signals"]
        TRACE["trace: span tree"]
        METRIC["metric: tokens / latency"]
        LOG["log: CLI stderr / app logs"]
    end

    TRACER --> TRACE
    ENABLE --> METRIC
    Sources --> LOG
    TRACE --> AppInsights[("Azure Monitor / App Insights")]
    AppInsights --> Foundry[("Foundry tracing UI")]
    METRIC --> MLflow[("Local MLflow UI :5000")]
Service-wide rollout (chat / cloud_agent / todo)
- Shared bootstrap and callback wiring now live in
concierge/observability.py. - CLI entrypoints use
--tracing,--mlflow,--verbose. - Web/worker entrypoints use:
CONCIERGE_TRACING_ENABLED=trueCONCIERGE_MLFLOW_ENABLED=true- Tracer names are fixed per service:
concierge-chatconcierge-cloud-agentconcierge-todo
How the toggles are implemented
The CLI defines a Typer callback that flips two module-level flags and lazily
enables the corresponding backend (see
scripts/microsoft_foundry/vanilla.py):
@app.callback()
def _global_options(
    tracing: bool = typer.Option(False, "--tracing", "-t"),
    verbose: bool = typer.Option(False, "--verbose", "-v"),
    mlflow:  bool = typer.Option(False, "--mlflow",  "-m"),
):
    global _tracing_enabled
    _tracing_enabled = tracing
    if mlflow:
        _enable_mlflow()
Every command then wraps its invoke / ainvoke / stream call with the
shared helper:
def _trace_config(extra=None) -> RunnableConfig:
    config = dict(extra or {})
    if _tracing_enabled:
        callbacks = list(config.get("callbacks", []))
        callbacks.append(_get_tracer())
        config["callbacks"] = callbacks
    return RunnableConfig(**config)
This is what keeps the per-command code free of conditional logic: the toggle is set once globally, and every LangChain call picks it up uniformly.
Why disable_tracing exists alongside enable_tracing
The enabled / disabled flag in concierge/observability.py is held in a
module-level mutable singleton (_state). Once enable_tracing() flips it
to True, the flag persists for the lifetime of the process unless something
actively resets it. That is why a paired disable_tracing() is part of the
public API. It is needed in four concrete situations:
- CLI flag symmetry.
--tracingis an opt-in flag that defaults toFalse. Each CLI bootstrap callsdisable_tracing()in theelsebranch so a staleTruevalue (left over from a prior session or an import side effect) cannot silently keep the tracer attached. Without this you could end up with traces being sent even when--tracingwas not passed (seeconcierge/chat/infrastructure/cli/app.py). - Environment-driven bootstrap.
bootstrap_from_env()treatsCONCIERGE_TRACING_ENABLED=falseas a deliberate intent to turn tracing off. In long-running processes where configuration may be reloaded, simply not enabling is not enough: we must actively disable so the previous state cannot leak forward. - Test isolation.
pytest runs many tests in the same process, so the module-level state
leaks across tests unless we explicitly reset it. The
_reset_state()helper intests/test_observability.pycallsdisable_tracing()for exactly this reason. - API completeness.
Exposing
enable/disable/is_enabledtogether gives future subcommands or per-request controls a deterministic way to manage the flag.
In short: as soon as you keep state in a process-wide singleton, an API to turn it on requires a matching API to turn it off.
Step 2a - Azure Monitor tracing
Why Azure Monitor
Foundry projects ship with a built-in tracing experience powered by Azure Monitor. Connecting it makes every LangChain run searchable from the Foundry portal alongside your other resources - no extra dashboards required.
Provision tracing in Foundry
Tracing requires that your Foundry project is linked to an Application Insights resource. Follow Trace LangChain and LangGraph apps with Microsoft Foundry and Azure Monitor to enable it from the portal if you have not yet.
Run with --tracing
uv run python scripts/microsoft_foundry/vanilla.py --tracing hello-world \
    --query "Trace this call please."
What this changes:
# _get_tracer() is created once per process and reused
AzureAIOpenTelemetryTracer(
    project_endpoint=get_microsoft_foundry_settings().azure_ai_project_endpoint,
    credential=DefaultAzureCredential(),
    name="microsoft-foundry-vanilla",
)
Verify
Open Microsoft Foundry → your project → Tracing. A new trace named
microsoft-foundry-vanilla should appear within a few seconds. You can drill
into the LangChain run tree, prompt, response, and token counts.
Cost vs. fidelity
The tracer captures full prompts and completions. Pair it with sampling or redact sensitive content via LangChain callback filters when you graduate beyond exploration.
Step 2b - MLflow local autologging
Why MLflow
Foundry tracing is excellent for shared environments, but during inner-loop development you want something fully local. MLflow's LangGraph integration auto-captures every LangChain / LangGraph run with a one-line setup and ships with a UI you can run on your laptop.
Start the MLflow server
The repository ships with a make target that exposes MLflow on
http://127.0.0.1:5000. Run it in a separate terminal because it keeps the
server process in the foreground:
This runs:
The CLI reads the tracking URI and experiment name from .env if present. The
defaults are declared in
concierge/settings/observability.py:
# .env
MLFLOW_TRACKING_URI=http://127.0.0.1:5000
# Optional; defaults to this value when omitted.
MLFLOW_EXPERIMENT_NAME=microsoft-foundry-vanilla
The shipped make mlflow target always starts the server on port 5000. If
you need another port, start MLflow manually and point the CLI at the same URL:
uv run mlflow server \
    --host 0.0.0.0 --port 5050 \
    --allowed-hosts "*" --cors-allowed-origins "*"

MLFLOW_TRACKING_URI=http://127.0.0.1:5050 \
    uv run python scripts/microsoft_foundry/vanilla.py --mlflow hello-world
Run with --mlflow
uv run python scripts/microsoft_foundry/vanilla.py --mlflow use-in-agents \
    --query "Explain why tracing helps debug LLM applications in one sentence."
_enable_mlflow() reads the observability settings, sets the tracking URI /
experiment, and calls mlflow.langchain.autolog(). The setup is cached within
the current Python process.
Send GitHub Copilot SDK traces to MLflow
When enable_mlflow() has succeeded (i.e. is_mlflow_enabled() returns
True),
build_copilot_sdk_telemetry_config()
returns a TelemetryConfig that GitHubCopilotSdkAgent forwards to the
Copilot CLI subprocess via
CopilotClient(config=SubprocessConfig(telemetry=...)). No extra code is
required: enabling --mlflow (or CONCIERGE_MLFLOW_ENABLED=true) is enough
for Copilot SDK spans to reach MLflow.
# One-shot via the CLI flag
uv run cloud-agent-cli --mlflow task dispatch \
  --agent-type github-copilot-sdk \
  --payload '{"message": "hello"}'

# Start the worker with MLflow on as well (the worker is what actually opens
# the Copilot session)
uv run cloud-agent-cli --mlflow worker run
Non-HTTP tracking URIs are skipped
The Copilot SDK telemetry path uses the OTLP HTTP exporter. When
MLFLOW_TRACKING_URI does not start with http:// / https://
(for example with a file: or sqlite: local backend),
build_copilot_sdk_telemetry_config() returns None and the agent
runs with a plain CopilotClient(). To capture Copilot SDK traces,
start an HTTP tracking server (e.g. mlflow server) and point
MLFLOW_TRACKING_URI=http://... at it.
Capturing prompts and responses
build_copilot_sdk_telemetry_config() constructs TelemetryConfig
with capture_content=False, so message bodies are not included in
spans. Flip it to capture_content=True in
concierge/observability.py if you need full prompt / completion
payloads in the traces (be mindful of sensitive content).
Verify
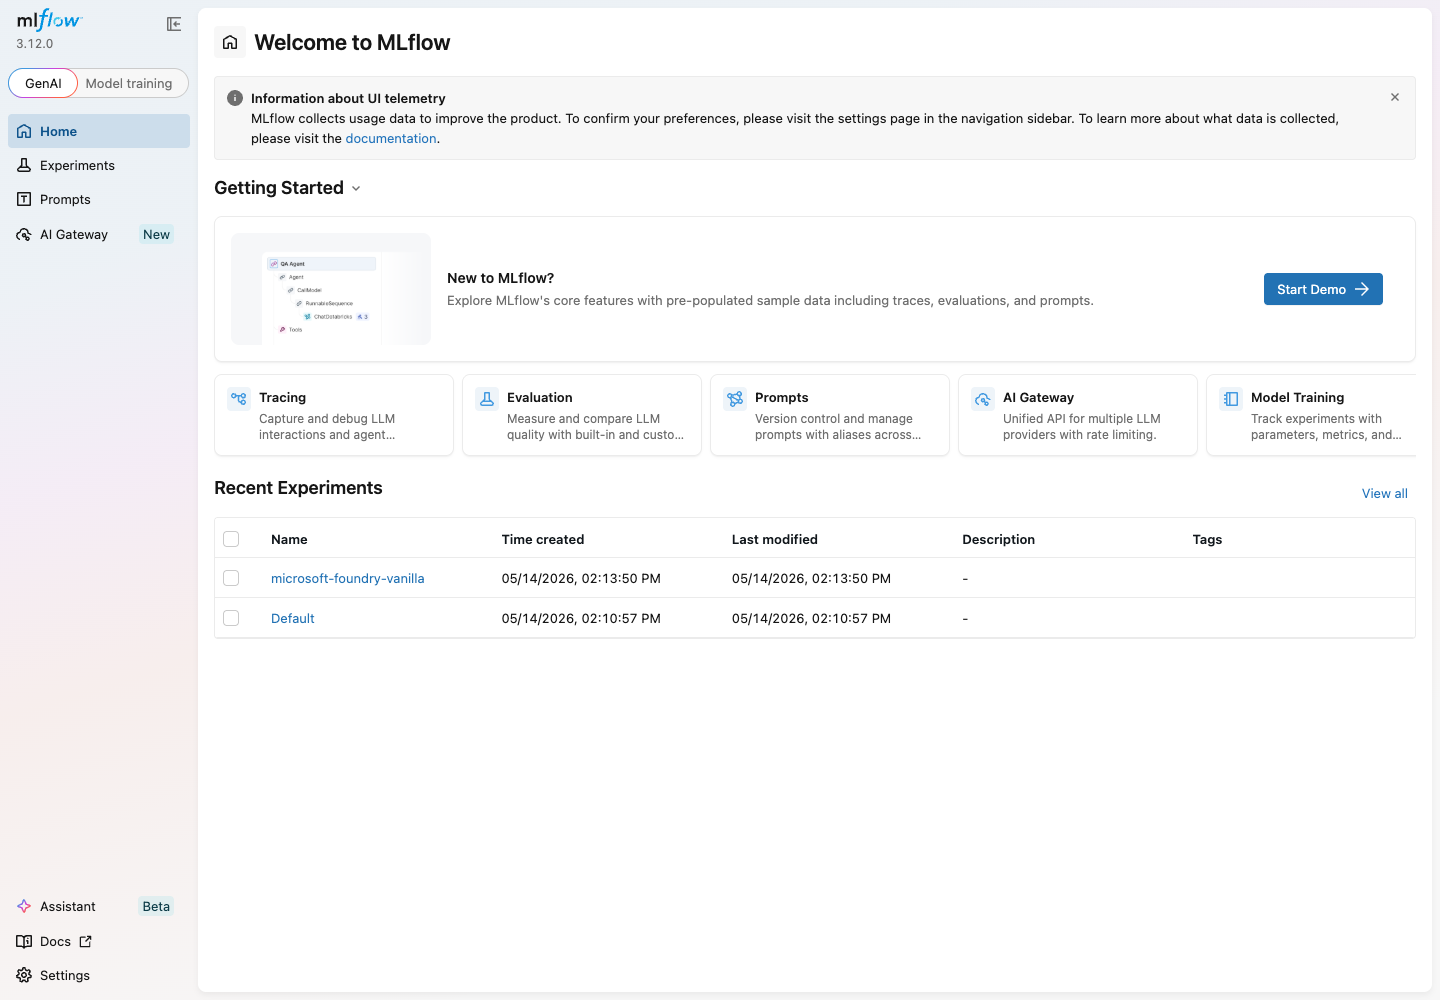
Open http://127.0.0.1:5000 in your browser. The MLflow GenAI home shows
your experiments under Recent Experiments:
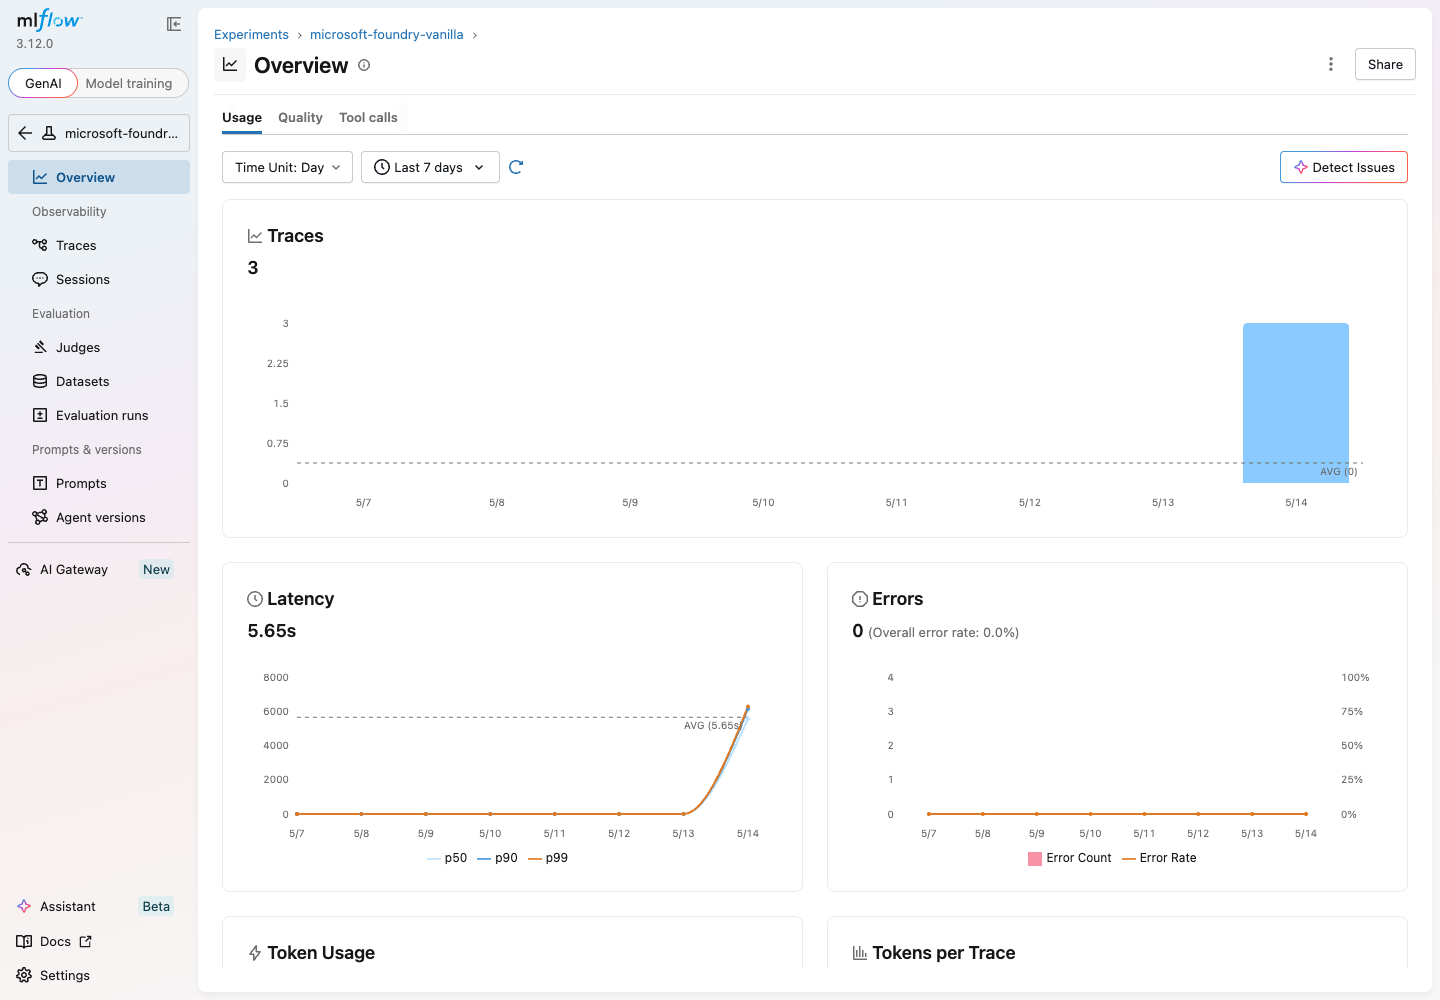
Click microsoft-foundry-vanilla to open the Overview page. It
aggregates traces, latency, error rate, and token usage over the last 7 days:
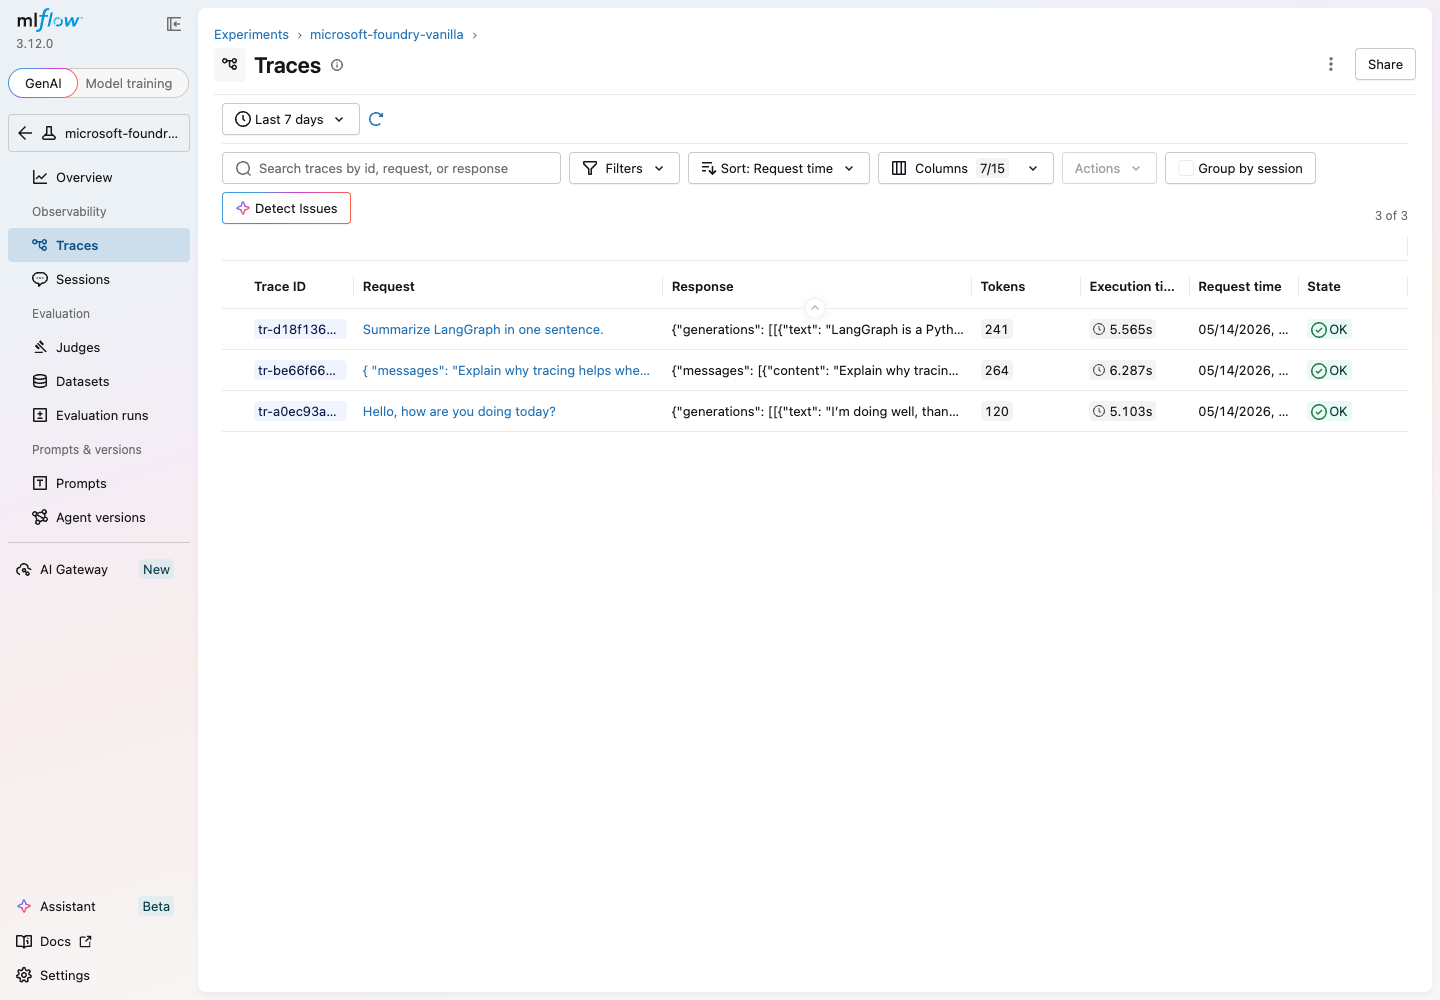
The Traces tab on the left lists every LangChain run captured by autolog. Each row shows the request, the response, token count, latency, and status:
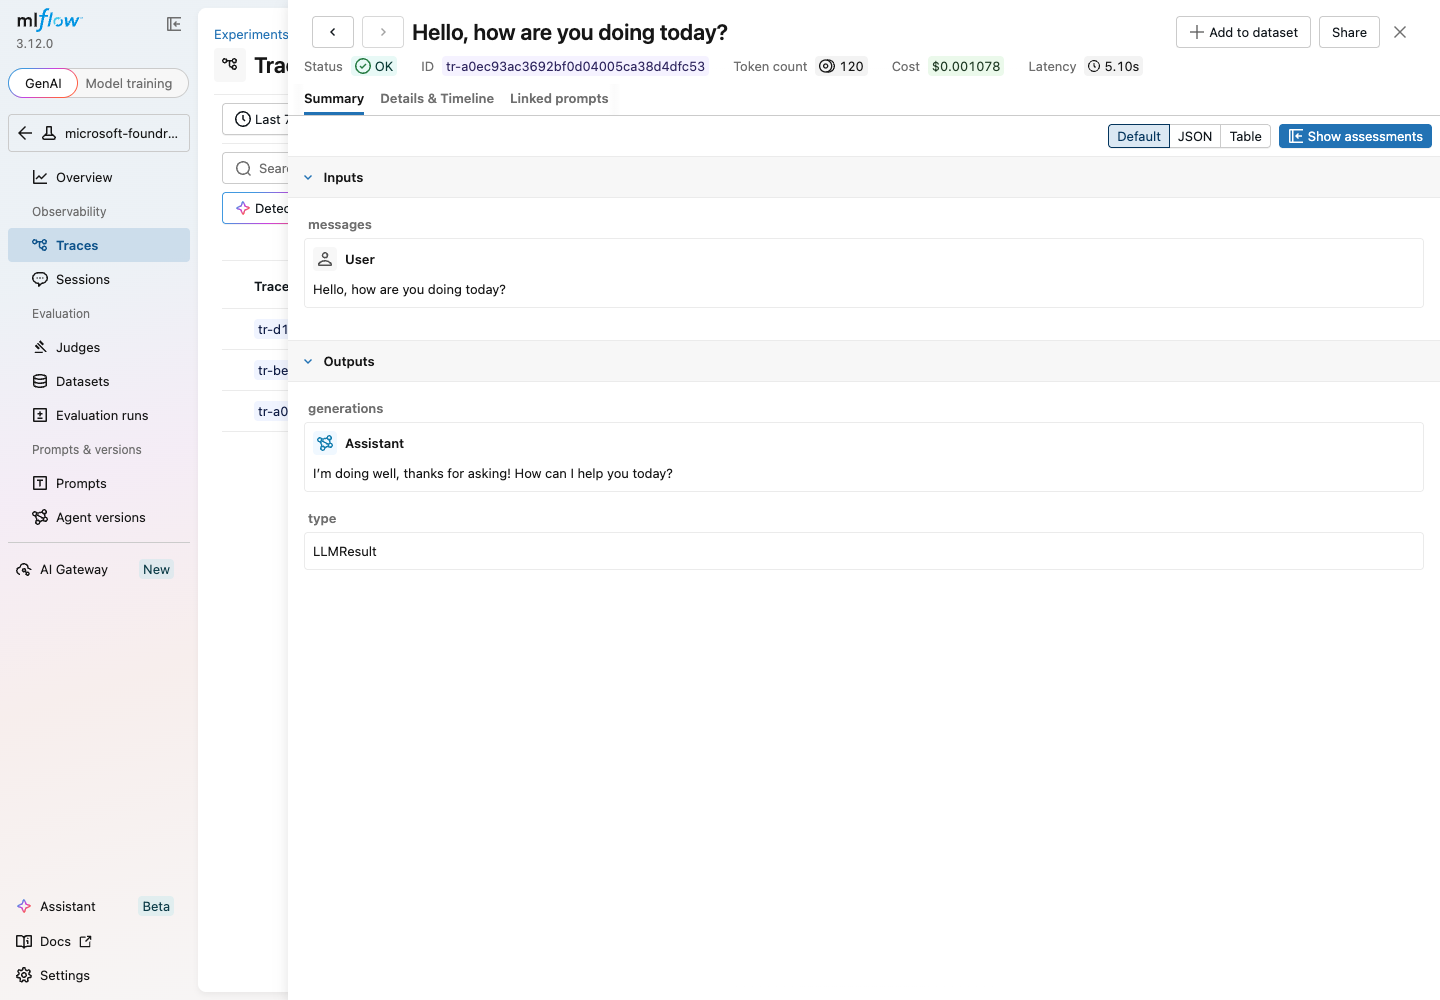
Click any trace to drill into the Summary view, which shows inputs, outputs, latency, token count, and estimated cost:
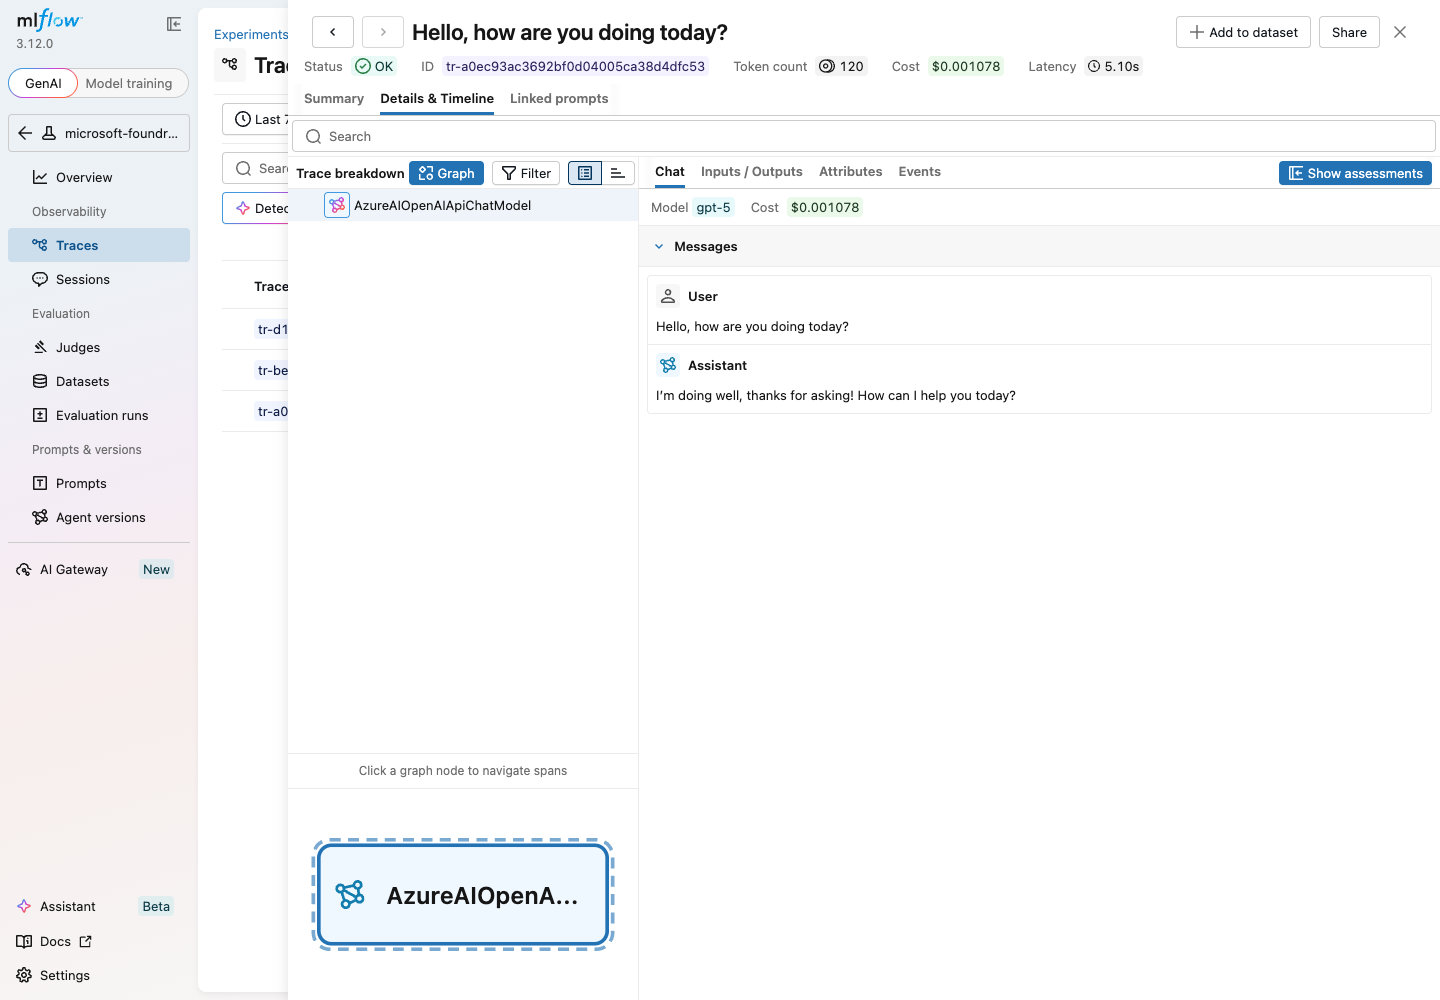
The sibling Details & Timeline tab breaks the run down span-by-span so
you can see which LangChain primitive (ChatPromptTemplate, the model call,
etc.) consumed the latency:
Combining both toggles
You can enable both backends at once when you want a Foundry-side audit trail and a local debugging view of the same call:
uv run python scripts/microsoft_foundry/vanilla.py --tracing --mlflow --verbose \
    reasoning --model azure_ai:DeepSeek-R1-0528
--verbose raises the local logger to DEBUG, which is useful while wiring
new commands.
Service command examples
# chat CLI / web
uv run chat-cli --tracing --mlflow message post <conversation_id> --content "hello"
CONCIERGE_TRACING_ENABLED=true CONCIERGE_MLFLOW_ENABLED=true uv run chat-web

# cloud_agent CLI / worker / web
uv run cloud-agent-cli --tracing --mlflow worker --max-iterations 1
CONCIERGE_TRACING_ENABLED=true CONCIERGE_MLFLOW_ENABLED=true uv run cloud-agent-web

# todo CLI / web (no LangChain path yet, but bootstrap is shared)
uv run todo-cli --tracing --mlflow task list
CONCIERGE_TRACING_ENABLED=true CONCIERGE_MLFLOW_ENABLED=true uv run todo-web
Verify the nearby code with tests
The current tests cover the logger and the settings classes the observability flow relies on:
They do not yet exercise _trace_config, tracer creation, or the MLflow
autolog hook. If you change that wiring, add focused tests with mocks and run
the suite before pushing.
Troubleshooting
Traces never appear in Foundry
Confirm that Tracing is enabled on your Foundry project and that your
identity has the Azure AI Developer role on the project. The tracer is
lazy: nothing is sent until the first call after --tracing is passed.
MLflow UI is empty
The autolog hook only fires after _enable_mlflow() has been called.
Make sure --mlflow is on the invocation that runs the model, not on
make mlflow (the server does not see your CLI runs unless they share the
same tracking URI).
Port 5000 already in use
Stop the previous make mlflow (Ctrl+C) or start MLflow manually on a
different port and set MLFLOW_TRACKING_URI on the CLI invocation. The
make mlflow target itself is fixed to port 5000.
github-copilot-sdk traces do not appear in MLflow
- Confirm
MLFLOW_TRACKING_URIis anhttp(s)://...URL.file:andsqlite:backends skip the Copilot SDK telemetry wiring. - Pass
--mlflowon the CLI invocation, or setCONCIERGE_MLFLOW_ENABLED=truein the environment. - The worker process is what actually runs the task, so make sure
MLflow is enabled on the worker (
--mlflow/CONCIERGE_MLFLOW_ENABLED=true), not just on the dispatch call. - Make sure the MLflow tracking server is reachable; the pre-flight
health check (
<MLFLOW_TRACKING_URI>/health) must succeed._is_mlflow_server_reachable()fails fast and disables every MLflow integration when the server is down, including the Copilot SDK telemetry path.
What's next
You now have a working, observable Foundry + LangChain CLI. To add a persistent vector store backed by pgvector (locally via Docker Compose or managed via Azure Database for PostgreSQL Flexible Server), continue with Step 3 - PostgreSQL (pgvector) CRUD.